Hearing loss statistics in Australia - Trends, costs & who’s affected
Hearing loss is one of the most common health conditions in Australia, affecting around 3.6 million people, nearly 1 in 10 Australians.1,2 New national data from Audika reveals how demand for hearing support has changed across age groups, genders & states between 2022 and 2024
We’ve pulled together the latest statistics, global research, and insights to show the impact of hearing loss, from Aussie households all the way to the national economy.
Stats at a glance
Audika has seen a 61% national increase in the number of appointments per clinic between 2022 and 2024, suggesting an increase in demand for hearing support.
Audika data also shows:
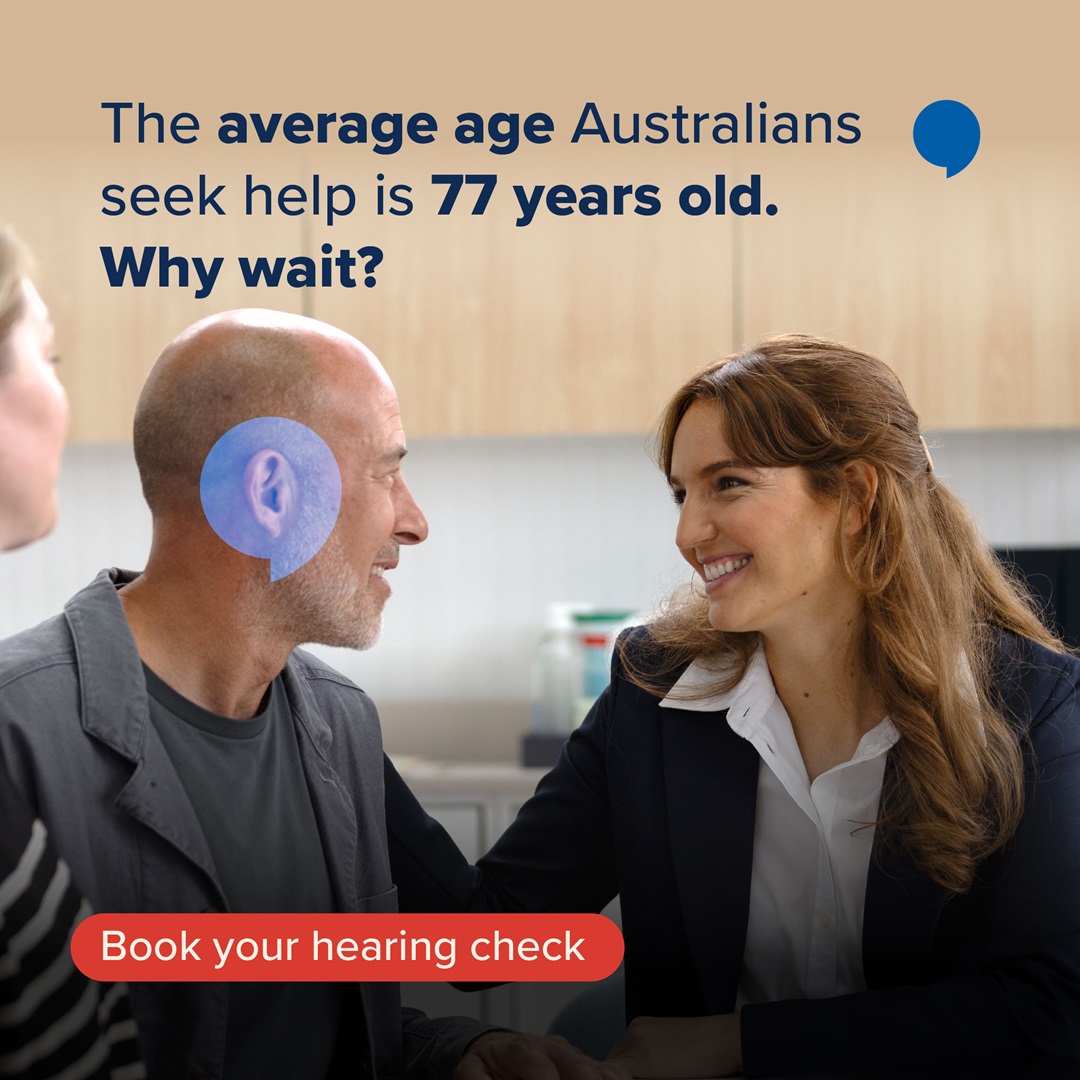
- The average age for people to seek hearing aid help is 77 years, down from 78 in 2020.
-
Gen Y or Z appointments between 2022 and 2024 increased by 62% overall and by 41% per clinic.3
-
NSW, QLD, and VIC account for 66% of hearing aid appointments between 2022 and 2024, but every state is affected.3
-
Men (56%) have had more hearing aid treatment than women (44%)3
Hearing loss is no joke, and can drive a range of negative outcomes:
-
Hearing loss costs the economy $33 billion annually, or $3.2 - $4.8k per household.4
-
Early checks matter, with untreated hearing loss linked to physical health impacts, higher rates of anxiety and depression, as well as poorer mental health.
Are Aussies waiting too long to get help with hearing loss?
Globally, 430 million people already experience disabling hearing loss, a figure expected to pass 700 million by 2050.5 And several million of those people can be found right here in Australia.
Across Australia, around 3.6 million people live with some form of hearing loss (Department of Health and Aged Care, 2023). That’s nearly 1 in 10 Australians (9.6%) (ABS, 2023). 1,2
That number jumps significantly once we look at older folks, with around 50% of people over 60 suffering from hearing loss, 70% of those over 70 years, and 80% of those over 80 years old.
Audika data shows the national average age for seeking help is 77 years. This is down slightly from 78 years in 2020, but it's still too high.3
In 2025, over 5 million Aussies were in their 60s and 70s, according to ABS data. If more than 50% of those have hearing loss, as health department data indicates, then millions of Australians are likely waiting too long to get their hearing checked.
Are younger Aussies getting their hearing checked?
While hearing loss is generally associated with age, the new Audika data finds that it's not just the elderly who are affected.
Younger generations are increasingly represented in Audika appointments, with the number of Gen Y and Gen Z getting their hearing checked having increased by an average of 41% per clinic, from 2022 to 2024.
This could be good or bad news. On one hand, there are new risks to the hearing of young people that have now been quite well researched.
For example, The World Health Organisation says 1 billion people aged 12 to 35 are at risk of hearing damage from recreational noise and music. In the grand scheme of things, portable headphones are a pretty recent invention, which may not be the cause of the jump in Audika data, but they may be a hearing loss crisis waiting to happen.6
On the other hand, it's possible that social media has increased awareness and access to information about hearing loss and its potential impacts. This could be that younger generations end up with better outcomes thanks to more diligent testing at an earlier age.
Average age Aussies are first seeking hearing treatment by generation
|
Generation by Age |
Average of Age |
|
Silent Generation |
86 |
|
Baby Boomers |
73 |
|
Gen X |
55 |
|
Gen Y |
39 |
|
Gen Z |
28 |
Source: Audika
Which states in Australia have the highest demand for hearing health?
Between 2022 and 2024, demand was highest in the most populous states, but every region contributed thousands of appointments. All data in this section is derived from Audika’s internal appointment data.³
NSW appointments make up the largest proportion of bookings, with 28% of all Audika bookings, while the Northern Territory makes up just 0.64%. This is broadly in line with state population sizes, with most of the differences likely being related to access to Audika services.
What we can compare across state lines is the growth in appointment number per clinic between 2022 and 2024. This controls for the population and the number of Audika clinics.
Tasmanians far and away represented the biggest growth market for Audika appointments, with an increase in appointments of 141% between 2022 and 2024. Next was NSW at 78%, followed by SA, QLD, and VIC which all grew by more than 50% over the 2 years.
Perhaps more than anything, these numbers reinforce that hearing loss is a nationwide issue, not confined to the large cities or the big eastern states.
|
Appointments per clinic |
% increase (2022 - 2024) |
|
NSW |
78% |
|
QLD |
55% |
|
VIC |
52% |
|
SA |
57% |
|
WA |
43% |
|
TAS |
141% |
|
ACT |
22% |
|
NT |
21% |
|
National increase |
61% |
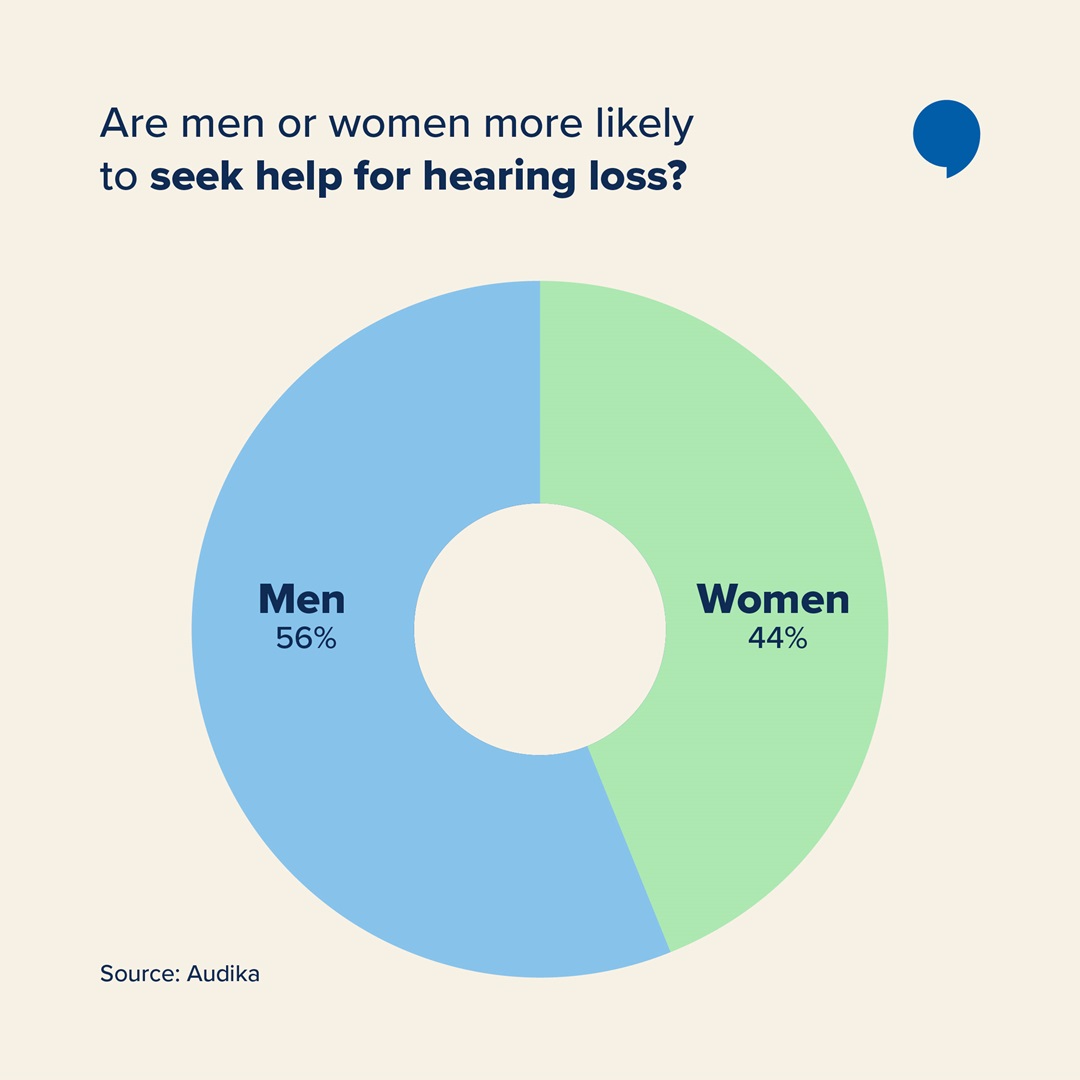
Are men or women more likely to seek help for hearing loss?
Audika’s data shows 56% of hearing aid appointments are for male clients, and 44% for women.
Across every state, we see that the average age of men seeking treatment is slightly lower than women. Men are more likely to have hearing loss than women, so this might be expected, but it's a good reminder that hearing loss can affect everyone.
|
|
Average age |
|
|
|
Female |
Male |
|
ACT |
79 |
78 |
|
NSW |
79 |
77 |
|
NT |
73 |
72 |
|
QLD |
77 |
76 |
|
SA |
79 |
77 |
|
TAS |
76 |
76 |
|
VIC |
79 |
77 |
|
WA |
78 |
77 |
It's worth noting in this data how much younger Audika clients in the Northern Territory tend to be. This is likely due to the lower median age of NT residents, 32 years, compared to the Australian national average of 38.
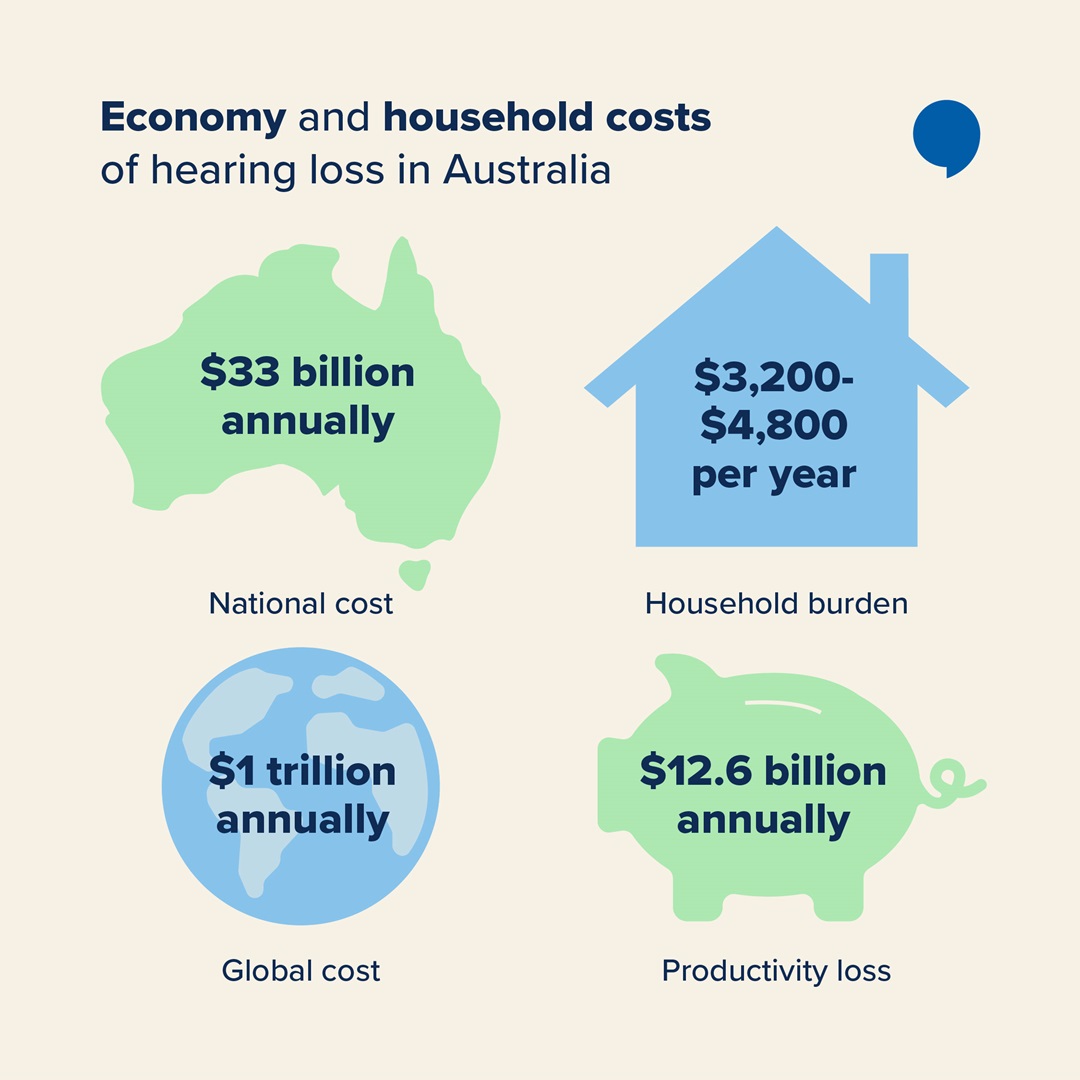
What is the cost of hearing loss in Australia?
The impact of hearing loss isn't just mishearing the grandkids at the dinner table. Hearing loss can have massive financial impacts as well, for both individuals and the national economy.
-
National cost: $33 billion annually4
-
Household burden: $3,200 - $4,800 per year4
-
Productivity loss: $12.6 billion annually from early retirement, reduced hours, or missed promotions.5
-
Global cost: US$1 trillion annually5
Why is early intervention important?
While most Australians still wait until their late 70s to seek help, the data shows younger people are beginning to engage with hearing care. That shift challenges the stereotype that hearing support is only for older Australians.3
The case for earlier checks is backed globally, with untreated hearing loss limiting education, employment, and communication.5
Regular hearing checks and early intervention has the potential to improve quality of life and reduce long-term costs for families, workplaces, and the health system.
Seeing young people get the message is great news. Unfortunately, older Australians are the ones most at risk. And it's a message they can't afford not to hear.
Sources
-
Department of Health and Aged Care, released 2023
-
ABS Health conditions prevalence 2022, released 2023
-
Audika Hearing Test Data (2019-2024)
Methodology
This report draws on data collected and analyzed by Audika to identify national trends in hearing health across Australia. The analysis focused on uncovering patterns in demand for hearing support, including geographic hotspots, demographic profiles, and year-over-year changes in appointment activity.
Step 1: Data Sourcing and Definition
1.1 Primary Data Source:
The analysis was based on de-identified appointment records extracted from Audika’s internal Client Relationship Management (CRM) system. This dataset represents appointment activity across all Audika clinics in Australia and provides insights into patterns of hearing support demand.
Key Data Points Extracted:
- Appointment Date (to enable year-over-year analysis)
- Patient Location (suburb and state)
- Patient Demographics (age group and gender)
- Appointment Attribution (e.g., Work Cover claim status)
1.2 Secondary Data Source:
Population data for each suburb was sourced from the Australian Bureau of Statistics (ABS) Census to allow comparison between appointment volumes and community population size.
Step 2: Data Preparation and Filtering
2.1 The raw CRM data was cleaned, de-identified, and aggregated by key variables such as state, suburb, gender, and year.
2.2 For suburb-level insights, a minimum appointment threshold was applied to ensure statistical reliability and protect individual privacy. Suburbs with fewer than the required number of appointments were excluded from the analysis.
2.3 Age data was grouped into generational categories (e.g., Baby Boomers, Gen X, Gen Y, Gen Z) to assess trends across different life stages.
Step 3: Data Analysis
The cleaned dataset was analyzed to generate insights across several dimensions of hearing health:
3.1 Geographic Analysis (State and Suburb Level)
- State-Level Demand: Appointment counts were grouped by state and year to calculate total demand and percentage growth over time
3.2 Suburb-Level Hotspot Identification
- Absolute Demand: Suburbs were ranked by total appointment volume.
- Proportional Demand: Appointment counts were adjusted for population size using ABS data to highlight suburbs with the highest relative demand for hearing care.
3.3 Demographic Profile Analysis
- Gender Distribution: Appointments were segmented by gender to identify trends and proportional differences.
- Age and Generational Trends: Average age and generational representation were analyzed nationally and by state and gender, including growth patterns over time.
3.4 Attribution Analysis
- Workplace Hearing Loss: The proportion of appointments linked to Work Cover claims was analyzed to estimate the impact of occupational hearing issues.
Step 4: Reporting and Visualization
The results were summarized into ranked tables, charts, and comparative lists to clearly present growth trends, demographic breakdowns, and key suburbs by both total and proportional demand.
Privacy and Data Protection
All analyses were performed on aggregated and de-identified data to maintain individual privacy and comply with applicable privacy laws. No personally identifiable information (PII) was used or disclosed in the preparation of this report. Findings are presented at a regional or demographic level only, ensuring that no individual or clinic can be identified from the published results.