Hearing Loss Hotspots
Hearing loss affects nearly 1 in 10 Australians, but some communities are seeking help for hearing loss at far higher rates. Audika has analysed data from its hearing health appointments to reveal the towns and suburbs where the most residents are seeking treatment.
Key Findings
- The suburb of Dubbo in Western NSW tops the nation for the highest number of people getting treatment for hearing loss
- Following are Mount Gambier in South Australia, Port Macquarie in NSW, and Bongaree/Bribie Island in QLD.
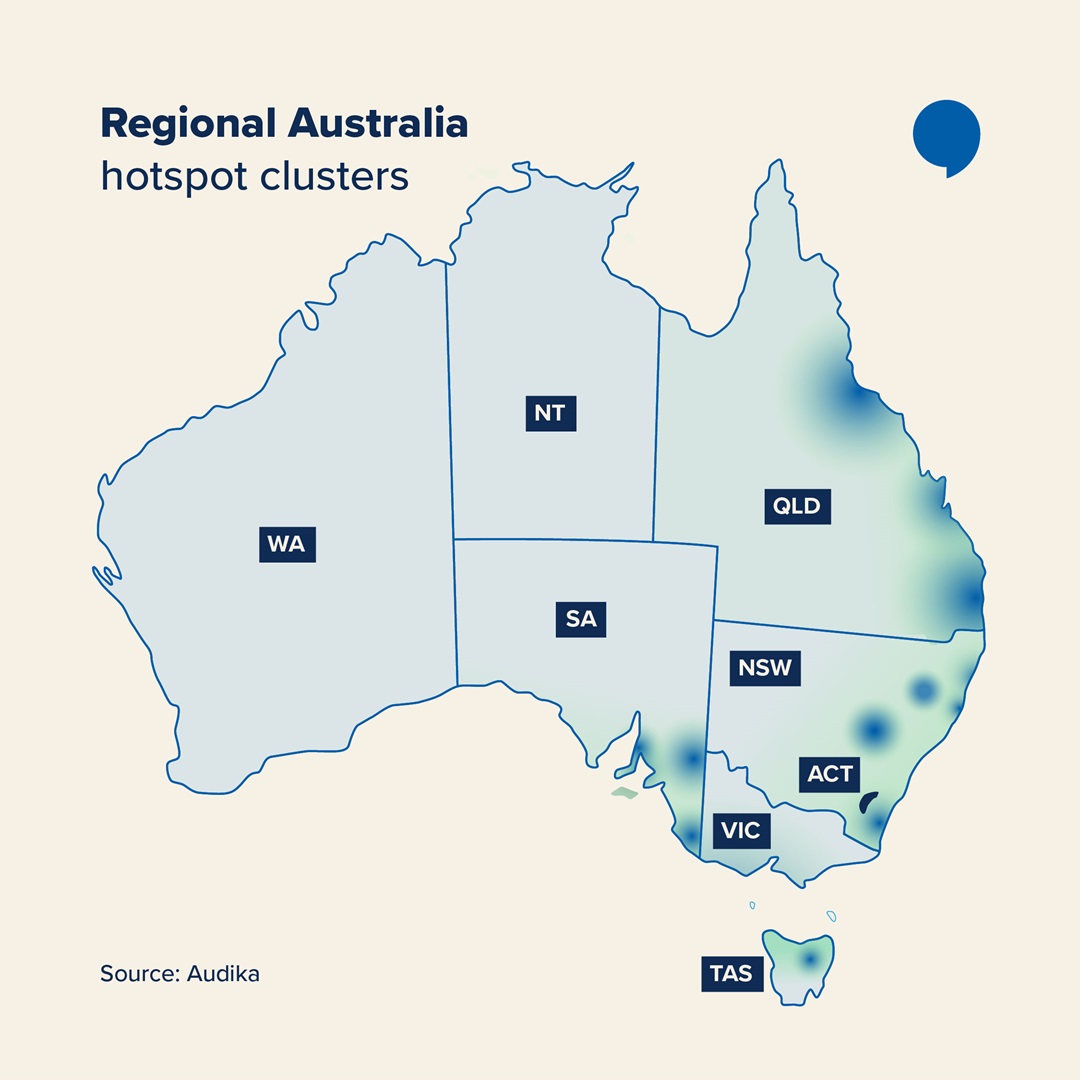
- Hearing-care demand for Audika services is highest in regional hubs and coastal retirement towns, likely reflecting the older average age and good access to Audika’s services in these areas.
- NSW has the most hotspots in the nation, with four Audika clinics in the Australian Top 10.
National Snapshot
Across Audika clinics, hearing-care demand has been steadily increasing.
- Audika appointments per clinic grew by 61% nationally between 2022 and 2024.
- Around 3.6 million Australians live with some form of hearing loss.
This growth isn’t evenly distributed. Audika’s clinics at regional and coastal centres recorded the highest engagement rates, while some inland towns are emerging as major Audika hearing health hubs.
Audika’s Top 10 Hearing Loss Hotspots
The table below lays out the top 10 suburbs for overall Audika appointments.
|
No |
Suburb name |
% of appointments |
|
1 |
Dubbo |
13.19% |
|
2 |
Mount Gambier |
11.10% |
|
3 |
Bongaree |
11.03% |
|
4 |
Port Macquarie |
10.93% |
|
5 |
Mornington |
10.45% |
|
6 |
Berwick |
10.11% |
|
7 |
Cowes |
9.32% |
|
8 |
Morphett Vale |
8.46% |
|
9 |
Caboolture |
7.71% |
|
10 |
Greenfields |
7.68% |
There are, of course, a few variables at play, the size of the town or suburb, the access to Audika services, and more. But the raw numbers give us some idea about just how many people might be struggling with hearing health and seeking support.
Audika’s State-by-State Hotspots: Where Hearing Loss Hits Hardest
While the national Top 10 highlights some of the towns with higher numbers of people seeking hearing treatment with Audika, going state by state gives us even more information.
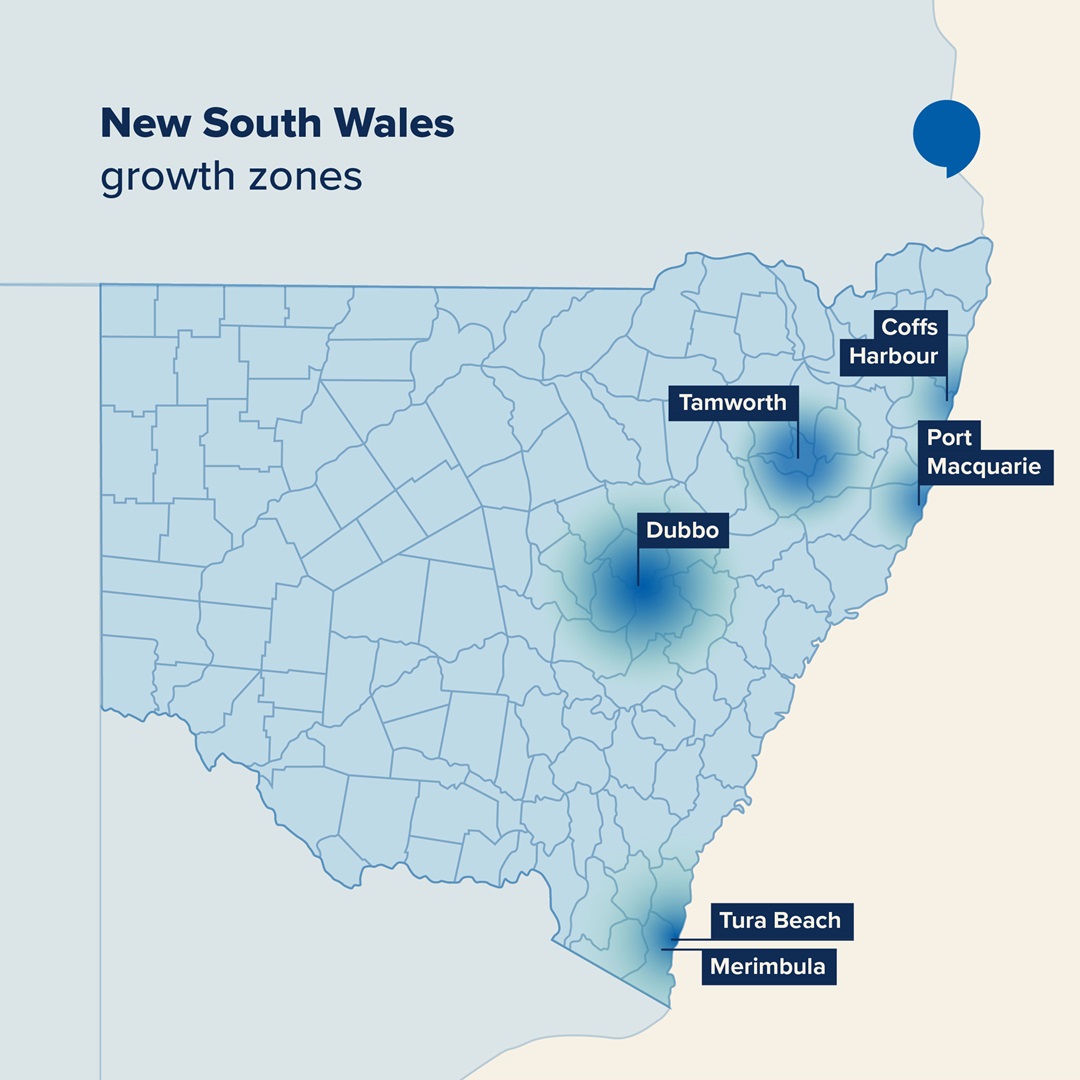
New South Wales
Dubbo leads the state for having the highest number of Audika hearing care appointments, followed by Port Macquarie and Cooma. The top 10 has a relatively even split of coastal and in-land towns represented.
However, the NSW south coast is a region of interest. The South Coast corridor, stretching from Tura Beach through Merimbula, accounts for four of the ten highest per-capita hotspots for people seeking hearing care, through Audika, in NSW.
|
The suburbs with the highest number of appointments for hearing care, relative to population |
||
|
Ranking |
Suburbs |
% increase in demand from 2020–2024 |
|
1 |
Tamworth |
38% |
|
2 |
Tura Beach |
126% |
|
3 |
Merimbula |
256% |
|
4 |
Eden |
147% |
|
5 |
Cooma |
229% |
|
6 |
Yamba |
29% |
|
7 |
Lithgow |
300% |
|
8 |
Kiama |
238% |
|
9 |
Erina |
6% |
|
10 |
Bowral |
305% |
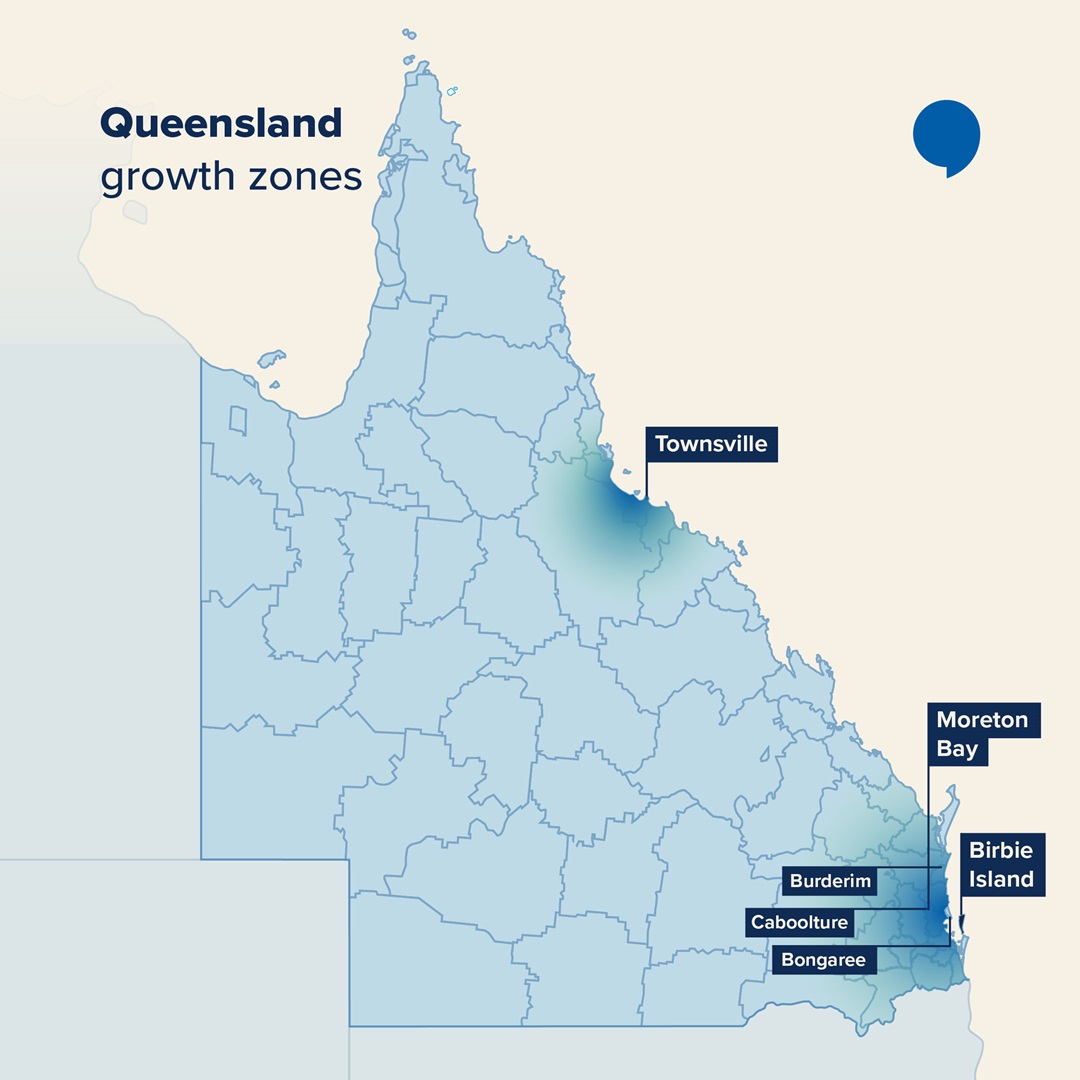
Queensland
Queensland’s hotspots reflect the state’s mix of coastal retirees and fast-growing regional centres. Bongaree on Bribie Island ranks as the state’s top hotspot for hearing appointments.
Nearby Caboolture and Buderim also feature strongly, consolidating the Moreton Bay and Sunshine Coast regions as a combined hearing-health cluster according to appointments at Audika.
|
The suburbs with the highest number of appointments for hearing care, relative to population |
||
|
Ranking |
Suburbs |
Increase in demand (2020–2024) |
|
1 |
Bongaree |
235% |
|
2 |
Sandstone Point |
139% |
|
3 |
Bellara |
145% |
|
4 |
Victoria Point |
87% |
|
5 |
Banksia Beach |
69% |
|
6 |
Nambour |
254% |
|
7 |
Noosaville |
370% |
|
8 |
Nerang |
100% |
|
9 |
Arundel |
40% |
|
10 |
Maryborough |
141% |
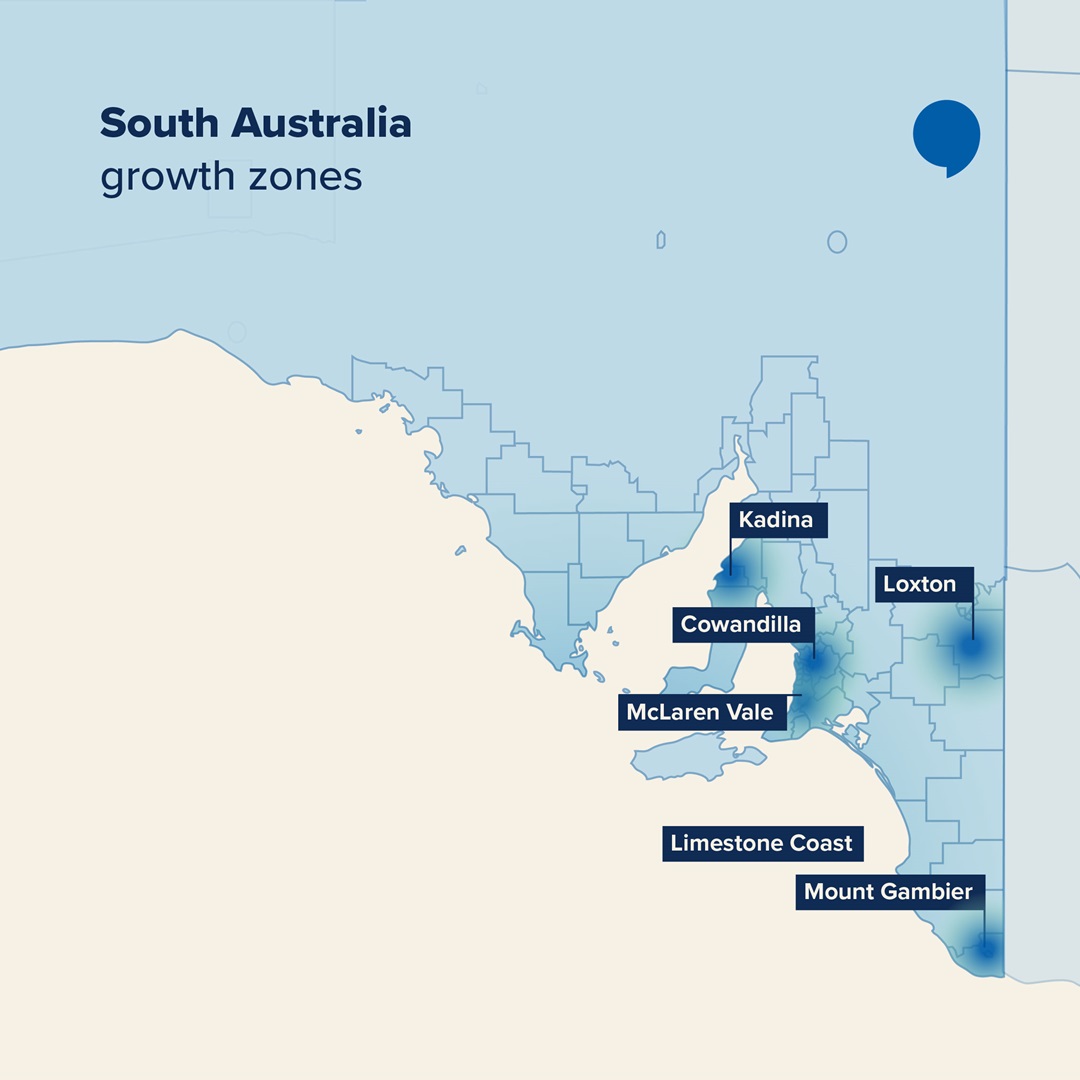
South Australia
In South Australia, Audika Mount Gambier leads the state and ranks second nationally.
However, closer to Adelaide there are some clear hotspots that emerge, particularly on the Fleurieu Peninsula, with Goolwa, Victor Harbour, and Encounter Bay all rank in SA's top 10. Nearby Murray Bridge also features on the list.
On the other side of the Spencer Gulf, two of Whyalla's suburbs are on the state's top 10, with Whyalla Stuart coming in at number 7, and Whyalla Norrie at number 6.
|
The suburbs with the highest number of appointments |
|
|
Ranking |
Suburbs |
|
1 |
Mount Gambier |
|
2 |
Morphett Vale |
|
3 |
Goolwa |
|
4 |
Victor Harbor |
|
5 |
Golden Grove |
|
6 |
Whyalla Norrie |
|
7 |
Whyalla Stuart |
|
8 |
Murray Bridge |
|
9 |
Encounter Bay |
|
10 |
Port Augusta |
|
The suburbs with the highest number of appointments for hearing care at Audika, relative to population |
||
|
Ranking |
Suburbs |
% increase in demand from 2020–2024 |
|
1 |
Loxton |
329% |
|
2 |
Kadina |
320% |
|
3 |
Mclaren Vale |
313% |
|
4 |
Wallaroo |
310% |
|
5 |
Whyalla |
291% |
|
6 |
Whyalla Stuart |
277% |
|
7 |
Stirling |
264% |
|
8 |
Morphett Vale |
260% |
|
9 |
Prospect |
242% |
|
10 |
Goolwa |
240% |
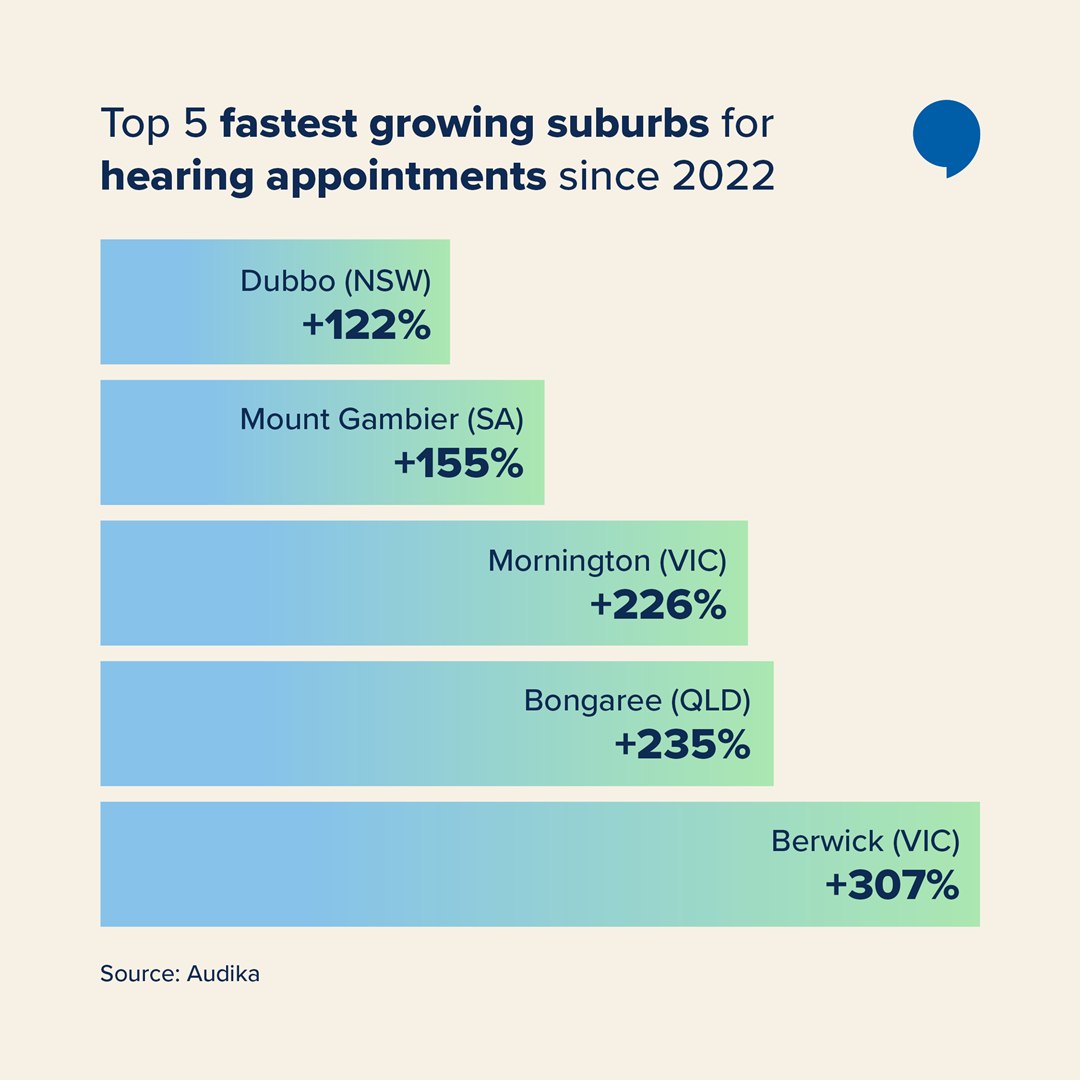
Fastest-Growing Hotspots
Some hotspots aren’t just high, they're growing fast. Between 2022 and 2024, the following towns saw growth in the number of hearing appointments:
- Bongaree (QLD) +235% growth
- Mount Gambier (SA) +155% growth
- Dubbo (NSW) +122% growth
- Mornington (VIC) +226% growth
- Berwick (VIC) +307% growth
This surge highlights both increased awareness and a rising need for accessible hearing services across Australia’s regional and coastal communities.
Why Hotspots Matter
By understanding where the greatest need for hearing care services lies, we are better equipped as a society to address the health needs of our humans. While the raw numbers don't tell us the reason for increased levels of hearing loss treatment, it allows us to redirect resources to where it's needed most.
In particular, the disparities in this report highlight the need for:
- Greater access to hearing services in regional hubs
- Increased awareness campaigns targeting small towns
- Ongoing monitoring of growth trends to anticipate future demand
Global evidence reinforces the stakes: untreated hearing loss is linked to social isolation and reduced workforce participation (WHO, JAMA 2024). With an ageing population, we can't afford to let people suffer in silence.
Methodology
This report combines Audika’s national hearing health data (2022–2024) with official population statistics from the Australian Bureau of Statistics (ABS) to identify the towns and regions where hearing support demand is highest.
Data Sources
Audika CRM dataset (2022–2024) - Data from Audika’s national network of clinics, aggregated at the suburb and state level. Each appointment represents a new and unique appointment for an individual seeking hearing support during the two-year period, with repeat or duplicate appointments excluded where applicable.
Population data - ABS Estimated Resident Population (ERP), June 2024, sourced from the Regional Population, Australia (SA2 and LGA) dataset (Catalogue 3218.0) and the most recent (ABS 2021) Census population data was used to provide consistent suburb-level comparisons.
ABS Regional Population Dataset
National Analysis
-
Appointments per capita - For each suburb or region, total Audika appointments (2022–2024) were divided by the corresponding ABS population, then multiplied by 100 to produce the percentage of the local population seeking hearing support.
-
Growth over time - Year-on-year changes in Audika appointment volume were used to calculate growth rates between 2020 and 2024.
-
Ranking criteria
National Top 10 - Suburbs ranked by appointments as a percentage of local population.
Fastest-Growing Hotspots - Suburbs ranked by percentage increase in Audika appointments (2022–2024).
State-by-State Hotspots - Top-performing suburbs within each state, based on both total Audika appointments and per-capita rates.
State-by-State Analysis
Audika analysed hearing appointment data covering the period 2020–2024 to identify suburbs where hearing loss support is most in demand.
Two complementary approaches were used:
-
Total number of appointments (raw numbers) — highlighting suburbs with the largest absolute demand for hearing loss support.
-
Appointments relative to population size — showing where hearing loss support is proportionally higher compared with the number of residents
Note: Some suburbs with high proportional rates have smaller overall appointment numbers. To maintain privacy and statistical reliability, only suburbs with a minimum appointment threshold were included in the analysis.
Interpretation
- The figures represent hearing support demand from Audika clinics across Australia, not prevalence of hearing loss. In this context, “% of population affected” refers to the proportion of local residents who sought help through Audika clinics during 2020–2024.
- Population figures are based on ABS SA2 regions, matched as closely as possible to suburb boundaries. Where a suburb spanned multiple SA2s or no direct match was available, the nearest population proxy (e.g., LGA or Census subdivision) was used.
- Minor rounding has been applied to percentages for readability.
References
-
https://www.aihw.gov.au/reports/australias-health/australias-health-2016/contents/summary